
How to Debug Hedera Services and Platform Sdk
Running the command k9s -A in terminal, and select one of the network nodes:
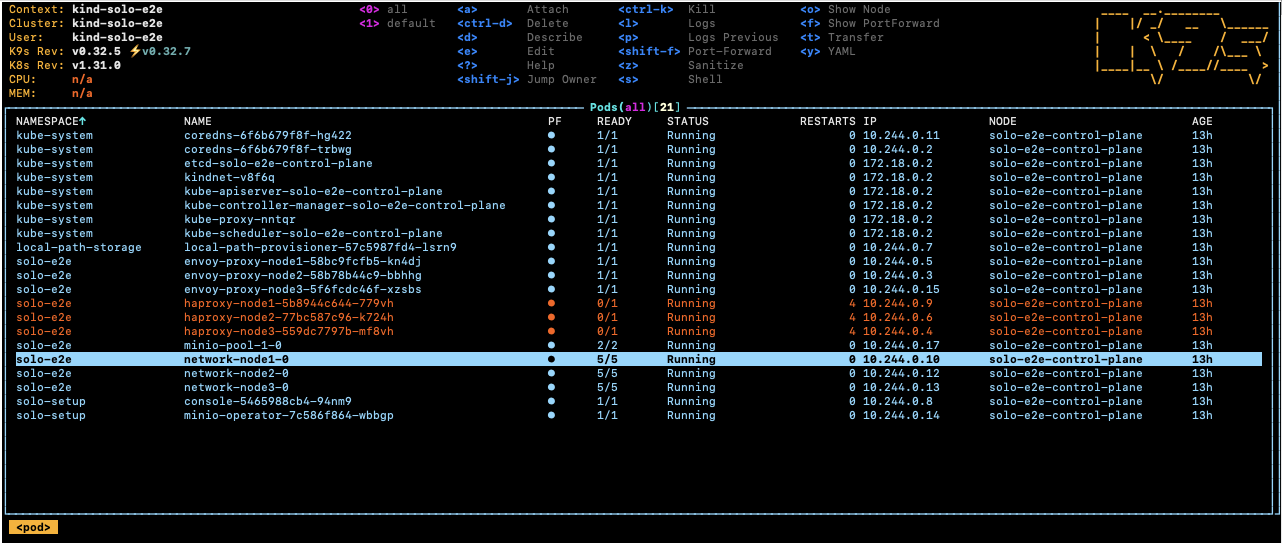
Next, select the root-container and press the key s to enter the shell of the container.
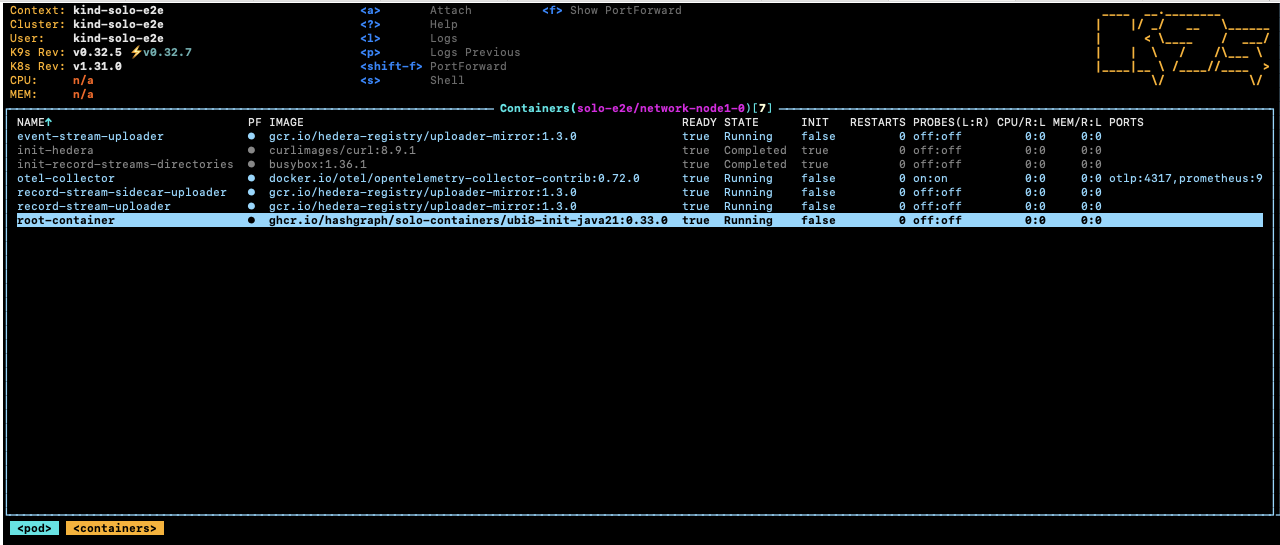
Once inside the shell, you can change to directory cd /opt/hgcapp/services-hedera/HapiApp2.0/
to view all hedera related logs and properties files.
[root@network-node1-0 hgcapp]# cd /opt/hgcapp/services-hedera/HapiApp2.0/
[root@network-node1-0 HapiApp2.0]# pwd
/opt/hgcapp/services-hedera/HapiApp2.0
[root@network-node1-0 HapiApp2.0]# ls -ltr data/config/
total 0
lrwxrwxrwx 1 root root 27 Dec  4 02:05 bootstrap.properties -> ..data/bootstrap.properties
lrwxrwxrwx 1 root root 29 Dec  4 02:05 application.properties -> ..data/application.properties
lrwxrwxrwx 1 root root 32 Dec  4 02:05 api-permission.properties -> ..data/api-permission.properties
[root@network-node1-0 HapiApp2.0]# ls -ltr output/
total 1148
-rw-r--r-- 1 hedera hedera       0 Dec  4 02:06 hgcaa.log
-rw-r--r-- 1 hedera hedera       0 Dec  4 02:06 queries.log
drwxr-xr-x 2 hedera hedera    4096 Dec  4 02:06 transaction-state
drwxr-xr-x 2 hedera hedera    4096 Dec  4 02:06 state
-rw-r--r-- 1 hedera hedera     190 Dec  4 02:06 swirlds-vmap.log
drwxr-xr-x 2 hedera hedera    4096 Dec  4 16:01 swirlds-hashstream
-rw-r--r-- 1 hedera hedera 1151446 Dec  4 16:07 swirlds.log
Alternatively, you can use the following command to download hgcaa.log and swirlds.log for further analysis.
# download logs as zip file from node1 and save in default ~/.solo/logs/solo-e2e/<timestamp/
solo node logs -i node1 -n solo-e2e
NOTE: the hiero-consensus-node path referenced ‘../hiero-consensus-node/hedera-node/data’ may need to be updated based on what directory you are currently in. This also assumes that you have done an assemble/build and the directory contents are up-to-date.
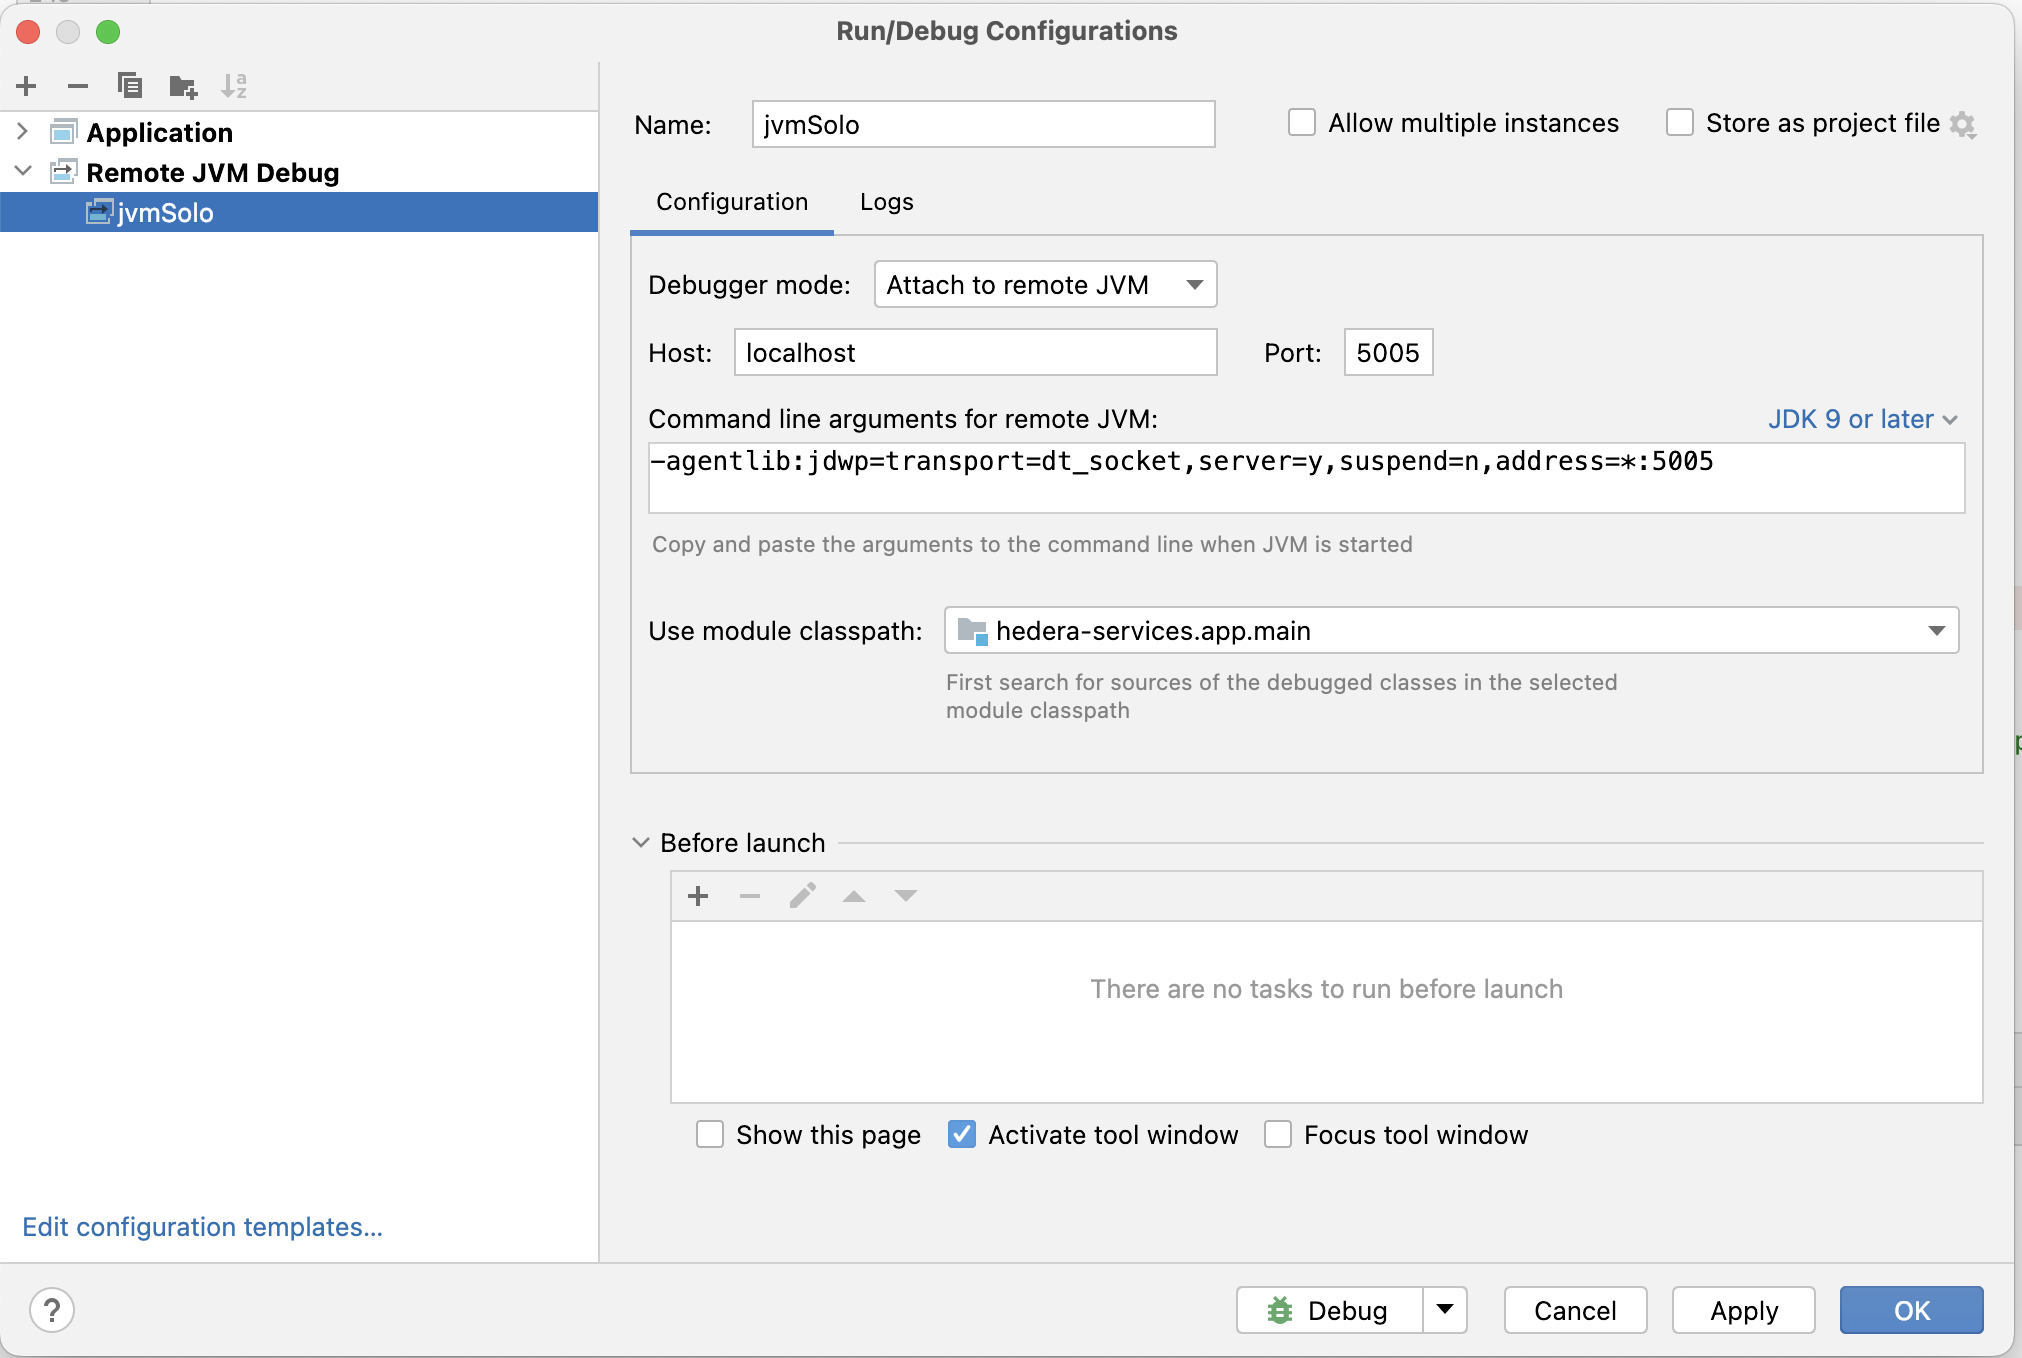
Setup a Intellij run/debug configuration for remote JVM Debug as shown in the below screenshot:
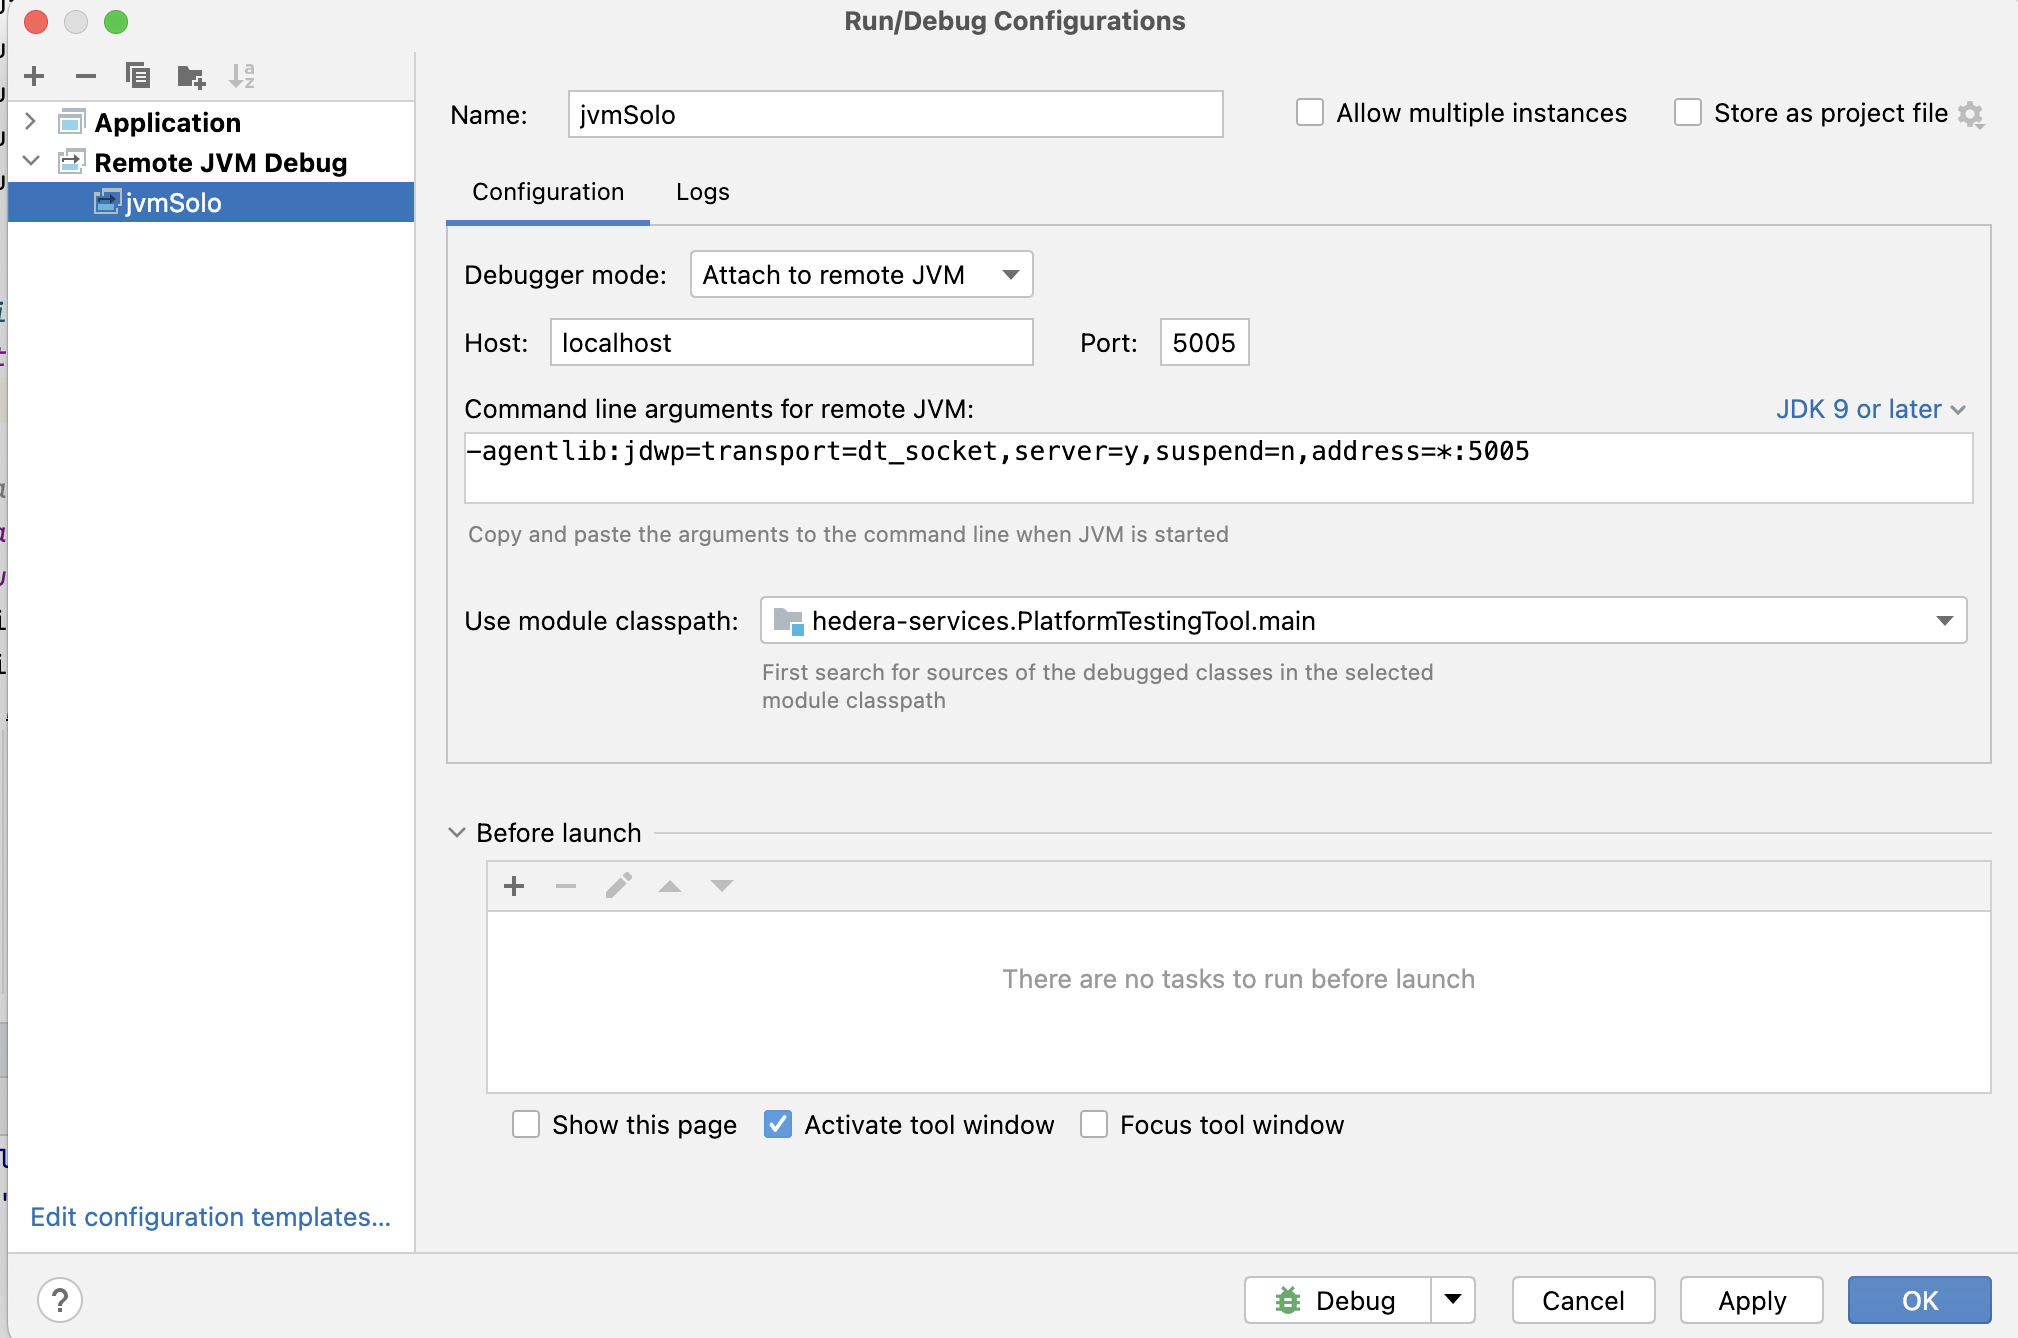
If you are working on platform testing application, you should use the following configuration in intellij:
Setup breakpoint if necessary.
From solo repo directory, run the following command from terminal to launch a three node network, assume we are trying to attach debug to node2 .
Make sure the path following local-build-path points to the correct directory.
Example 1: attach jvm debugger to a hedera node
./test/e2e/setup-e2e.sh
solo node keys --gossip-keys --tls-keys -i node1,node2,node3
solo network deploy -i node1,node2,node3 --debug-node-alias node2 -n "${SOLO_NAMESPACE}"
solo node setup -i node1,node2,node3 --local-build-path ../hiero-consensus-node/hedera-node/data -n "${SOLO_NAMESPACE}"
solo node start -i node1,node2,node3 --debug-node-alias node2 -n "${SOLO_NAMESPACE}"
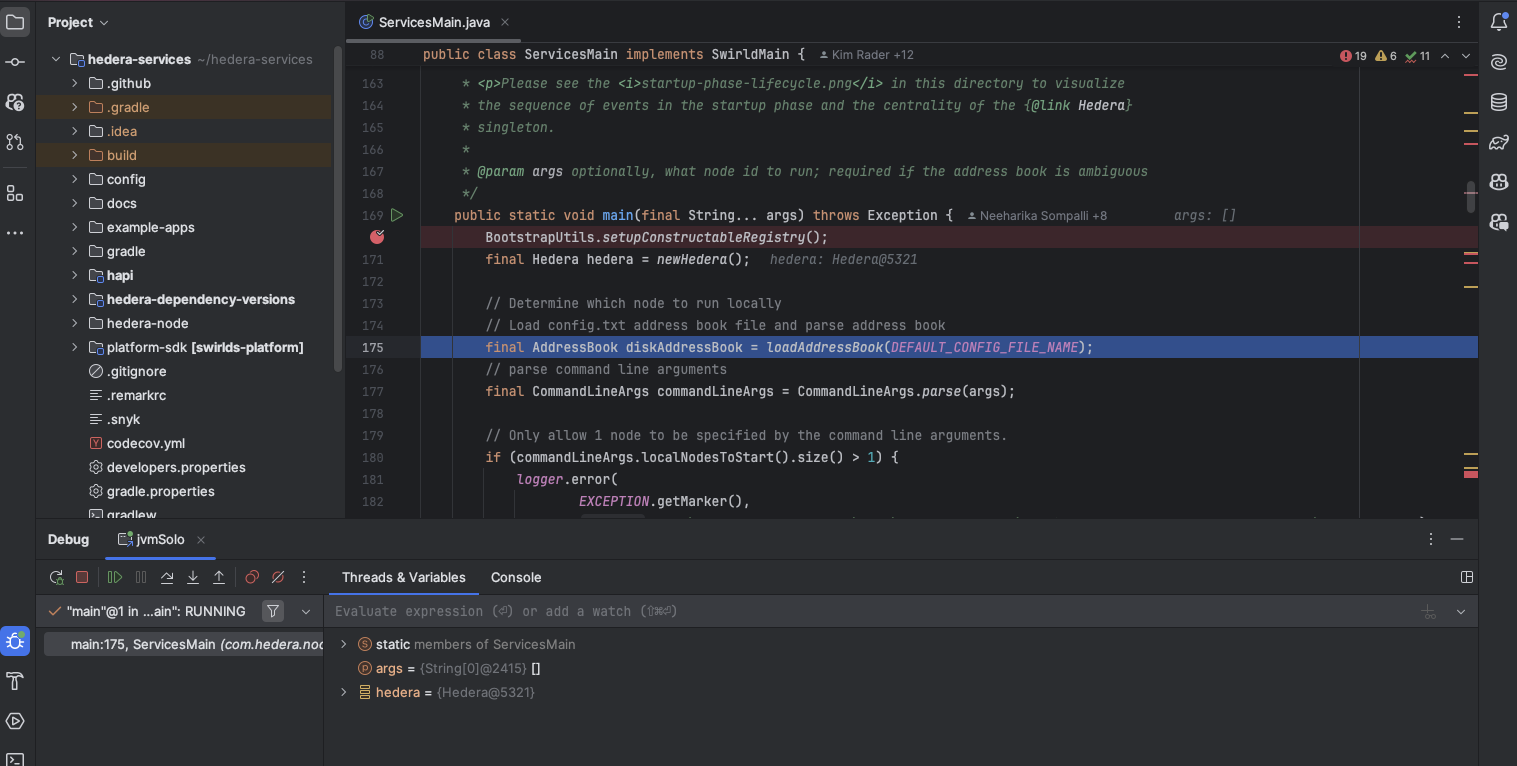
Once you see the following message, you can launch jvm debugger from Intellij
❯ Check all nodes are ACTIVE
  Check node: node1,
  Check node: node2,  Please attach JVM debugger now.
  Check node: node3,
The Hedera Application should stop at the breakpoint you set:
Example 2: attach jvm debugger with node add operation
./test/e2e/setup-e2e.sh
solo node keys --gossip-keys --tls-keys -i node1,node2,node3
solo network deploy -i node1,node2,node3 --pvcs -n "${SOLO_NAMESPACE}"
solo node setup -i node1,node2,node3 --local-build-path ../hiero-consensus-node/hedera-node/data -n "${SOLO_NAMESPACE}"
solo node start -i node1,node2,node3 -n "${SOLO_NAMESPACE}"
solo node add --gossip-keys --tls-keys --debug-node-alias node4 --local-build-path ../hiero-consensus-node/hedera-node/data -n "${SOLO_NAMESPACE}" --pvcs true
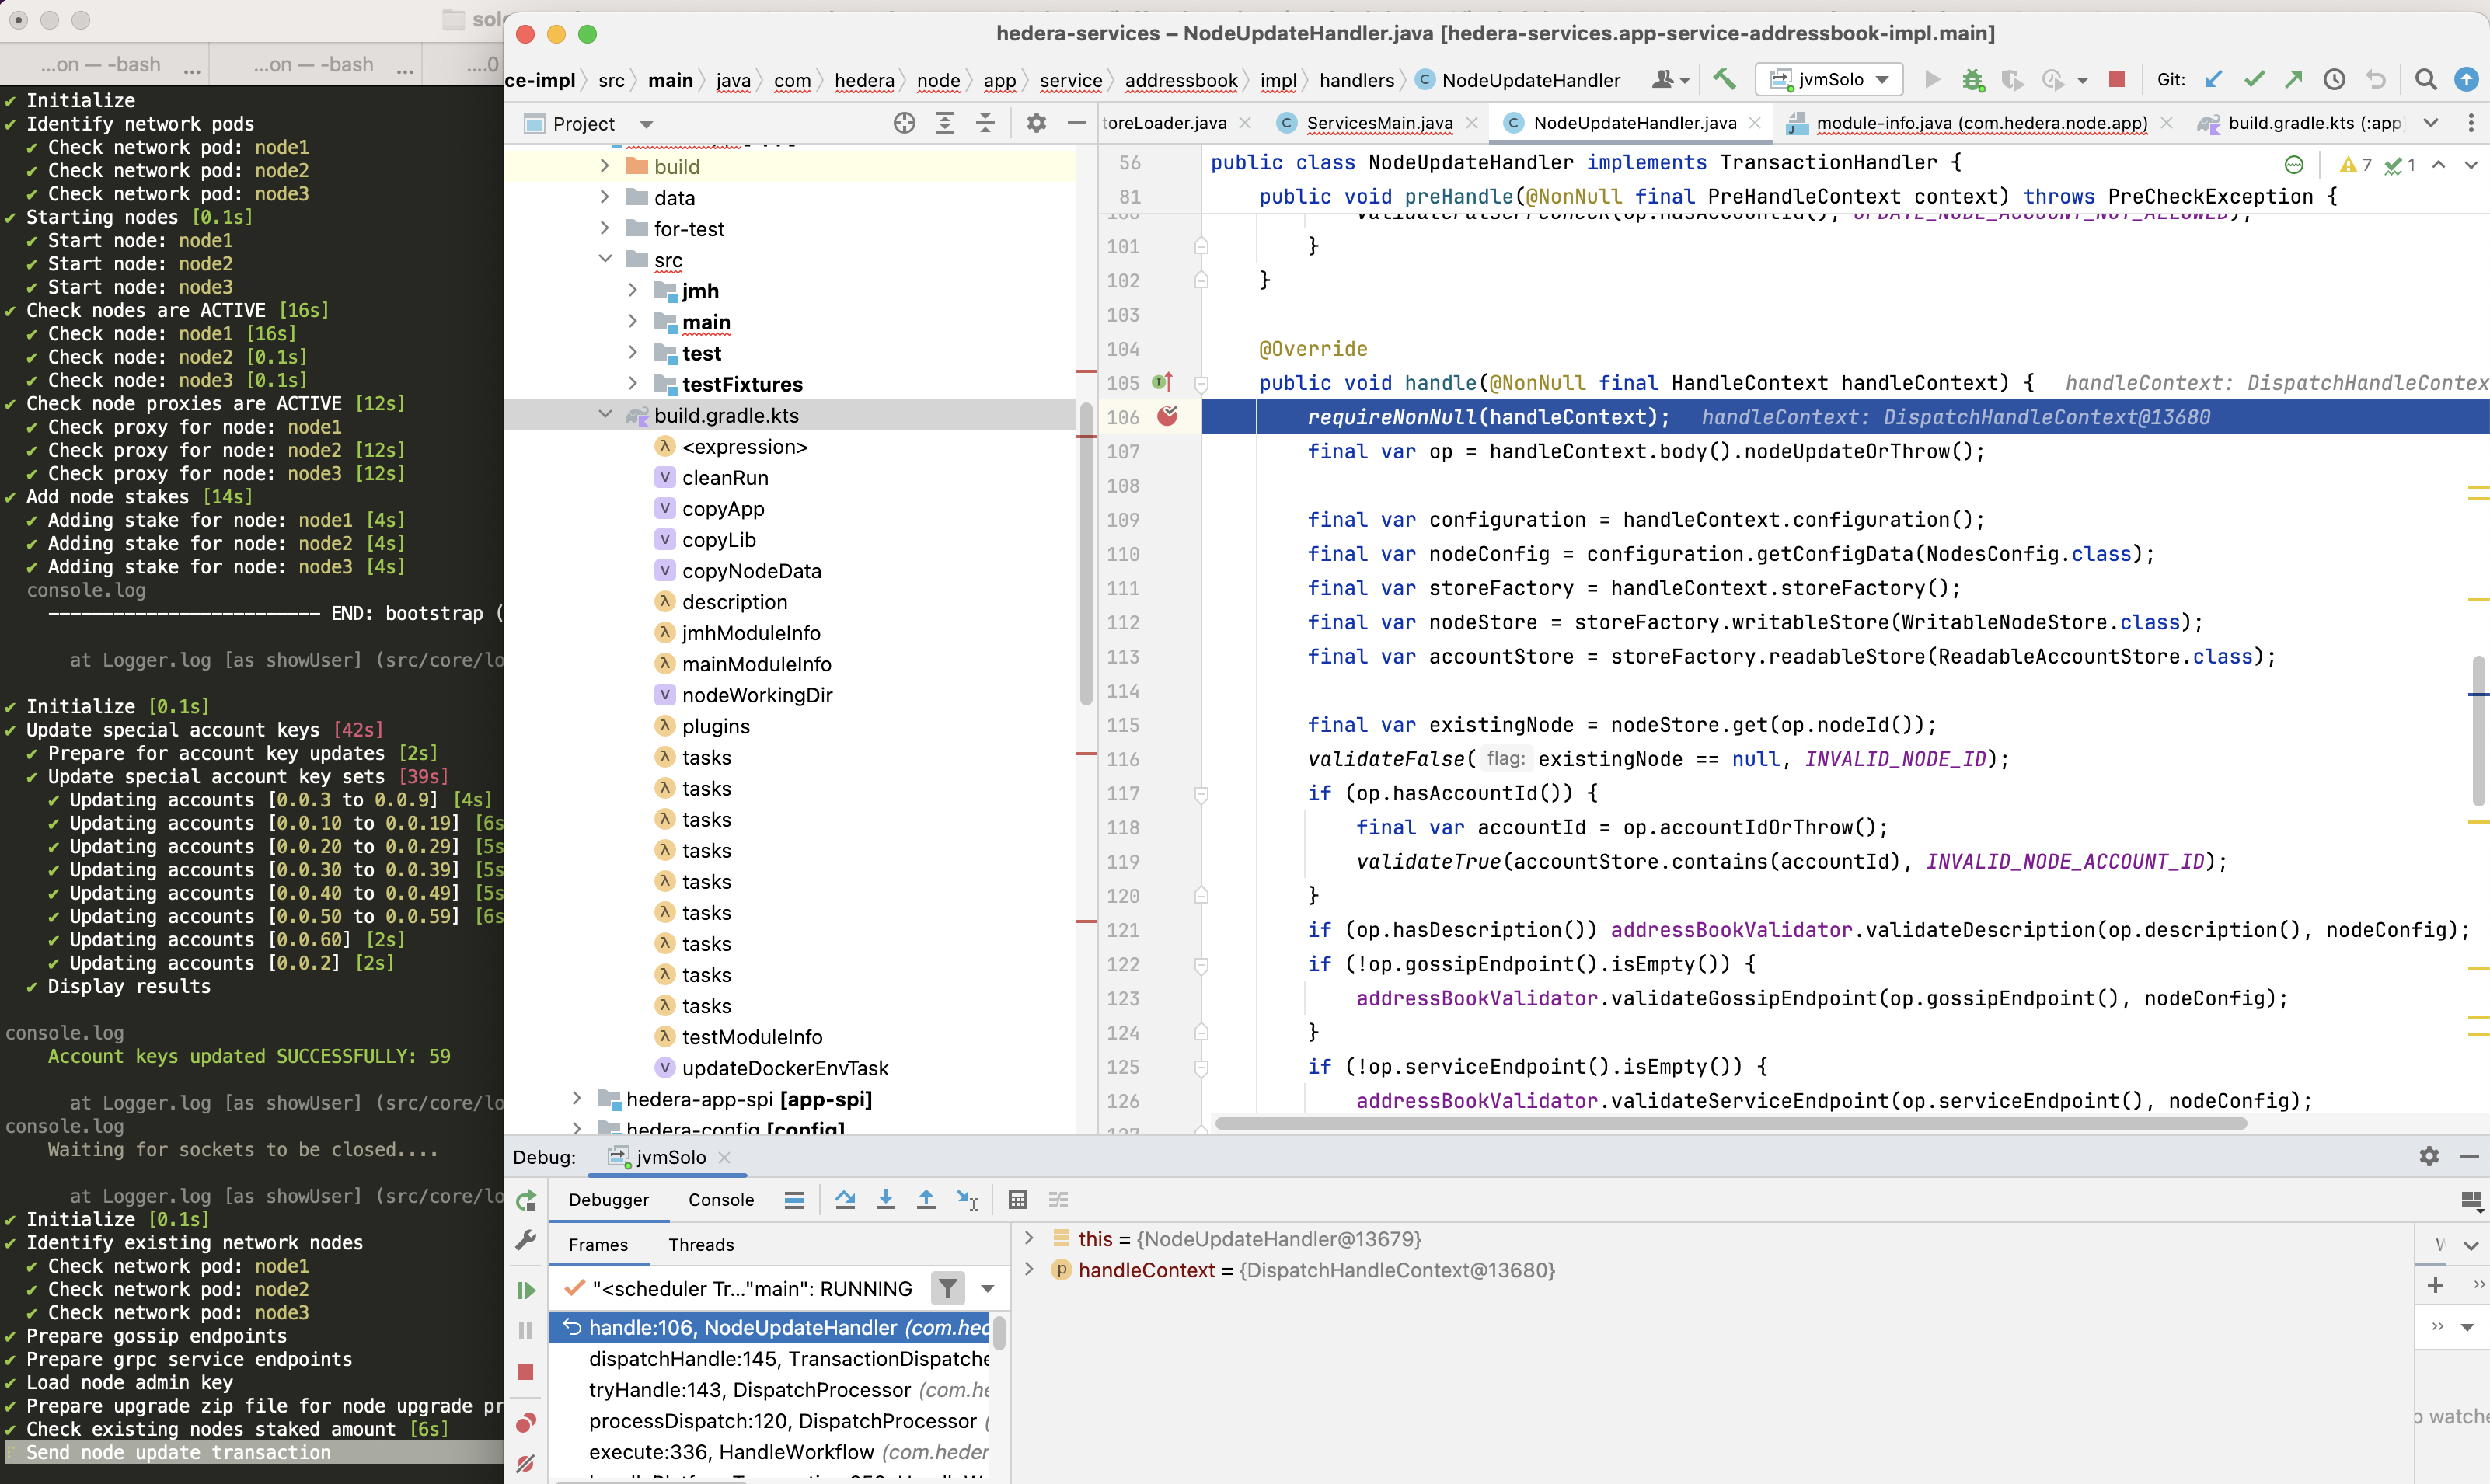
Example 3: attach jvm debugger with node update operation
./test/e2e/setup-e2e.sh
solo node keys --gossip-keys --tls-keys -i node1,node2,node3
solo network deploy -i node1,node2,node3 -n "${SOLO_NAMESPACE}"
solo node setup -i node1,node2,node3 --local-build-path ../hiero-consensus-node/hedera-node/data -n "${SOLO_NAMESPACE}"
solo node start -i node1,node2,node3 -n "${SOLO_NAMESPACE}"
solo node update --node-alias node2  --debug-node-alias node2 --local-build-path ../hiero-consensus-node/hedera-node/data --new-account-number 0.0.7 --gossip-public-key ./s-public-node2.pem --gossip-private-key ./s-private-node2.pem  -n "${SOLO_NAMESPACE}"
Example 4: attach jvm debugger with node delete operation
./test/e2e/setup-e2e.sh
solo node keys --gossip-keys --tls-keys -i node1,node2,node3
solo network deploy -i node1,node2,node3,node4 -n "${SOLO_NAMESPACE}"
solo node setup -i node1,node2,node3,node4 --local-build-path ../hiero-consensus-node/hedera-node/data -n "${SOLO_NAMESPACE}"
solo node start -i node1,node2,node3,node4 -n "${SOLO_NAMESPACE}"
solo node delete --node-alias node2  --debug-node-alias node3 -n "${SOLO_NAMESPACE}"
With the following command you can save the network state to a file.
# must stop hedera node operation first
solo node stop -i node1,node2 -n solo-e2e

# download state file to default location at ~/.solo/logs/<namespace>
solo node states -i node1,node2 -n solo-e2e
By default, the state files are saved under ~/solo directory
└── logs
    ├── solo-e2e
    │   ├── network-node1-0-state.zip
    │   └── network-node2-0-state.zip
    └── solo.log
Later, user can use the following command to upload the state files to the network and restart hedera nodes.
./test/e2e/setup-e2e.sh
solo node keys --gossip-keys --tls-keys -i node1,node2,node3
solo network deploy -i node1,node2,node3 -n "${SOLO_NAMESPACE}"
solo node setup -i node1,node2,node3 --local-build-path ../hiero-consensus-node/hedera-node/data -n "${SOLO_NAMESPACE}"

# start network with pre-existing state files
solo node start -i node1,node2 -n solo-e2e --state-file network-node1-0-state.zip